Decode Market Dynamics with Techniques Trusted by Wall Street
Power Your Trading With Science
Sign Up for our free news-letter
Innovative trading tools
Navigating market complexity
Complexity Trading, provides advanced indicators that operate at the edge of chaos. Our indicators empower traders to make informed decisions by equipping them with the next generation of trading tools used on the Street. Our systems are designed to highlight the structural complexities of ever-shifting markets and can assist you in evaluating any timeframe or market regime.
Whether you are a seasoned trader or just starting out, our resources are designed to enhance your trading experience by revealing the information hidden in price data.
Join us in redefining your trading experience.
Our Flagship Tool the LPPLCP© (Log Periodic Power Law Critical Pulse©) is opening to Private Access soon. Register your interest
here

Tools Focused on Market Structure
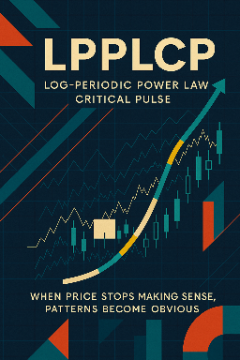
LPPLCP©
Upgraded & Enhanced Version
LPPLCP
A multi-tiered visual framework that fuses LPPL structural criticality with dynamic phase overlays, designed to illuminate the evolving rhythm beneath price behavior. It surfaces early signs of exhaustion, convergence, and instability for contextual interpretation—not prediction—allowing experienced users to observe emerging tensions before they resolve into price action. Adaptable across timeframes, though effectiveness may vary with market structure, volatility regime, and analytical intent.
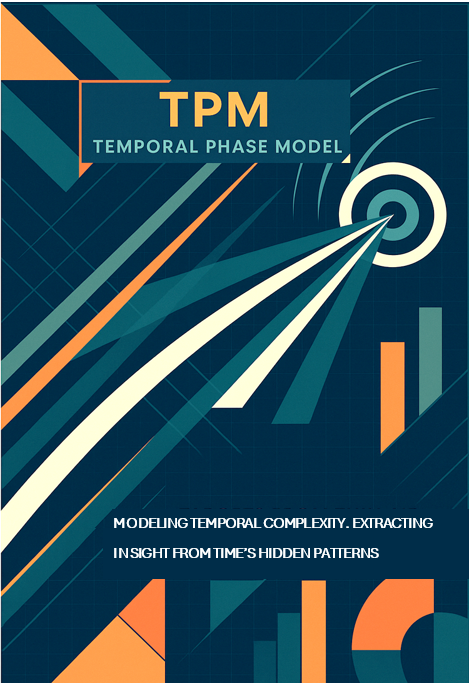
TPM©
(Now Available)
Access TPM Tool
TPM (Temporal Phase Model) is a structural analytics engine designed to surface directional attractors, zones where market structure exhibits persistent draw. Rather than predicting price, it maps asymmetries in structural behavior over time, highlighting regions of localized influence and their expected duration. These attractors are not forecasts, but real-time expressions of pull, adaptive, dynamic, and informed solely by internal structural logic. TPM reveals where the balance of market pressure leans, without offering entry signals, targets, or trade instructions. It is a lens for interpreting structural tension, not a system for generating trades.
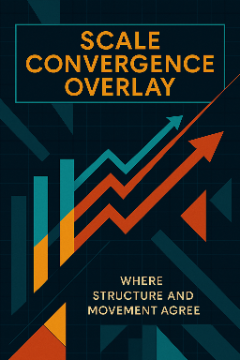
SCALE CONVERGENCE OVERLAY©
(Now Available)
SCO
A structural alignment overlay designed to reveal when multiple time-domain layers begin to shift in synchrony. SCO blends normalized signals from orthogonal models into a composite rhythm, helping experienced users detect evolving consensus across Micro, Meso, and Macro tiers. It offers a real-time perspective on regime fluidity...not trade entries...supporting contextual awareness in environments where structure, volatility, or direction may be rebalancing. Interpretation requires domain expertise and should be used in conjunction with complementary tools and discretion.
SIDE©
(Now Available)
SIDE
(Scale Invariant Dual Estimator) detects directional agreement between two structurally distinct models, each operating with independent logic. It doesn't forecast, signal, or react...it listens. When both systems reach alignment and pass internal strength thresholds, SIDE expresses that consensus as a system state, not a recommendation. It’s not a trade cue. These are moments of internal coherence, surfaced only when the underlying structure agrees with itself.
THE PILL©
(Now Available)
THE PILL
The Pill is a behavioral rhythm lens designed to observe when market structure shifts from passive drift into active directional flow. It does not predict outcomes or issue signals, instead, it interprets internal price behavior through adaptive logic, highlighting moments when structure appears to gain coherence. Blue suggests constructive rhythm; red implies disorganization or loss of intent. These are not instructions, but visual cues, meant to be interpreted, not followed. Best used in conjunction with structural tools like SCO or TPM, The Pill helps contextualize when potential movement begins to carry weight.
Overwatch©
(Coming Soon)
Overwatch
Overwatch acts as a real-time risk management lens. It's your structural risk officer across multiple timeframes. It consolidates five independent engines, tracking flow pressure, volatility asymmetry, structural tension, rhythm instability, and regime drift, into a single adaptive Risk Score. This score is color-coded for interpretive clarity, not prediction, and reflects shifting market fragility from stable to critical. Overwatch doesn’t generate signals or directional advice; it provides a continuous reading on systemic conditions so users can align tactics with context. It is a strategic overlay for assessing vulnerability, not a decision-making system.
LPPL CORELINE©
(Coming Soon)
LPPL CORELINE
Coreline maps dynamic market containment, identifying the boundaries where price tends to stall, reverse, or break free. It does not predict price, issue signals, or chase momentum. Instead, it observes how price behaves at structural thresholds, measuring conviction and response. By highlighting the zones of absorption and containment, Coreline helps contextualize price behavior, not as noise, but as structure. It distinguishes motion from meaning, offering a calm lens on whether price is confined or attempting escape.
VOLATILITY BURST TRACKER©
State Change Can Be Quantified.
Forget pure reaction. Our framework is built to surface structural shifts before they show up in conventional metrics. Together, these tools form a symbiotic framework, each offering a distinct perspective on structure, rhythm, risk, and regime, coordinated to expose when markets shift from motion to meaning.
Most Tools Guess. Ours Measure.
Rather than chase price, we analyze market structure. Using critical-state modeling, adaptive signal convergence, and modular logic, the platform offers high-resolution insights for anyone on Trading View
Key capabilities
- Track compression, coherence, exhaustion, and volatility buildup
- Combine modules to create custom strategies
- Operate on live data with no repainting logic
- Minimize interpretation overhead through clear visual outputs

Read Structure. Navigate the Shift.
- Highlight early signs of structural compression
- Flag potential exhaustion zones that can precede reversals
- Track alignment across multiple signal layers
- Quantify developing volatility instability in real time
- Visualize confluence without redundant overlap
- Leverage modular components to craft your own logic
Disclaimer!: For educational purposes only. Not investment or trading advice. No representation of accuracy or completeness; no guarantees. Trading involves risk, and past performance is not indicative of future results. You are solely responsible for your own decisions.
Charts, tools, and indicators utilized on this site are primarily provided by TradingView®. TradingView® is a registered trademark of TradingView, Inc., and holds no affiliation with the website owner, developers, or providers described herein.