© 2025 complexitytrading.ai All rights reserved.
The Pill Indicator – What It Is (And Isn’t)
Forget candle patterns. Forget momentum oscillators. Forget pretending you can time the market with a moving average crossover.
The Pill isn’t here to predict. It doesn’t promise reversal signals or trend confirmation. It doesn’t know your trading style, your timeframe, or your bias.
Instead, it listens to market rhythm. It analyzes price behavior for adaptive, real-time cycles and highlights when price structure is transitioning from drift to drive. From movement to momentum.
The Pill measures when the underlying price energy begins to organize.
It doesn’t care about MACD, RSI, or RSI’s cousin’s cousin. It isn’t a signal machine. It isn’t interested in being early or late.
It shows you when the dominant price structure has aligned enough to matter.
A shift in color isn’t a guarantee. It’s a readout: the system has transitioned from passive to active, from possibility to direction.
The Pill is...
⦁ A dynamic rhythm detector
⦁ A filter for chaotic price behavior
⦁ A real-time expression of cycle-based phase transition
⦁ A structure-first tool designed to reveal movement when it matters
⦁ Most effective when paired with structure-alignment tools like SCO, TPM, and LPPLCP
The Pill isn’t...
⦁ A buy/sell signal engine
⦁ A lagging trend confirmation tool
⦁ A volatility squeeze detector
⦁ A traditional oscillator
⦁ A predictive model
What It Actually Tells You
The Pill line tracks the real-time shift in underlying cycle phase and strength. When it flips color, it suggests that internal price rhythm has shifted — from weak to directional, from reactive to structural.
You can think of it like this:
⦁ When the line flips blue, the price structure has moved into a constructive rhythm. Momentum is building.
⦁ When it flips red, the market’s internal order has decayed or reversed. Momentum is dispersing.
It doesn’t tell you what price will do. It tells you what price is capable of doing.
Used alone, it helps with market timing. Used with structural overlays (SCO, TPM), it can validate structural alignment and timing.
Using The Pill With Other Structural Tools
The Pill is most powerful when used as part of a larger structure-aware framework.
While it can function independently as a rhythm and momentum detector, its signal becomes more meaningful in the context of other Complexity Trading tools:
⦁ SCO (Scale Convergence Overlay) helps detect when price structure across multiple timeframes is aligning.
⦁ TPM (Temporal Phase Model) identifies attractors in the market’s structural field — where price may be drawn.
⦁ SIDE (Scale-Invariant Dual Estimator) measures the stability of these structural alignments.
⦁ LPPLCP monitors critical regime pressure and compression dynamics that often precede sharp directional movement.
When combined:
⦁ SCO shows when the structure aligns.
⦁ TPM shows where that structure is pulling.
⦁ PILL reveals when price is beginning to move with that structure.
⦁ SIDE confirms whether that structure is holding steady or destabilizing.
⦁ LPPLCP signals whether pressure is building under the surface.
The Pill confirms momentum. The others reveal context.
Used together, they offer structural insight across timing, direction, stability, and flow.
Confluence and Structural Alignment
The Pill doesn’t act in isolation — its real power comes from context. When used in combination with alignment-based tools like SCO and TPM, it helps identify confluence: the moment when structural agreement translates into actionable momentum.
Confluence occurs when:
⦁ Structure (TPM) points somewhere
⦁ Alignment (SCO) confirms coherence
⦁ Momentum (The Pill) begins to flow in that direction
The Pill doesn’t predict confluence. It validates it.
And when everything aligns, behavior emerges.
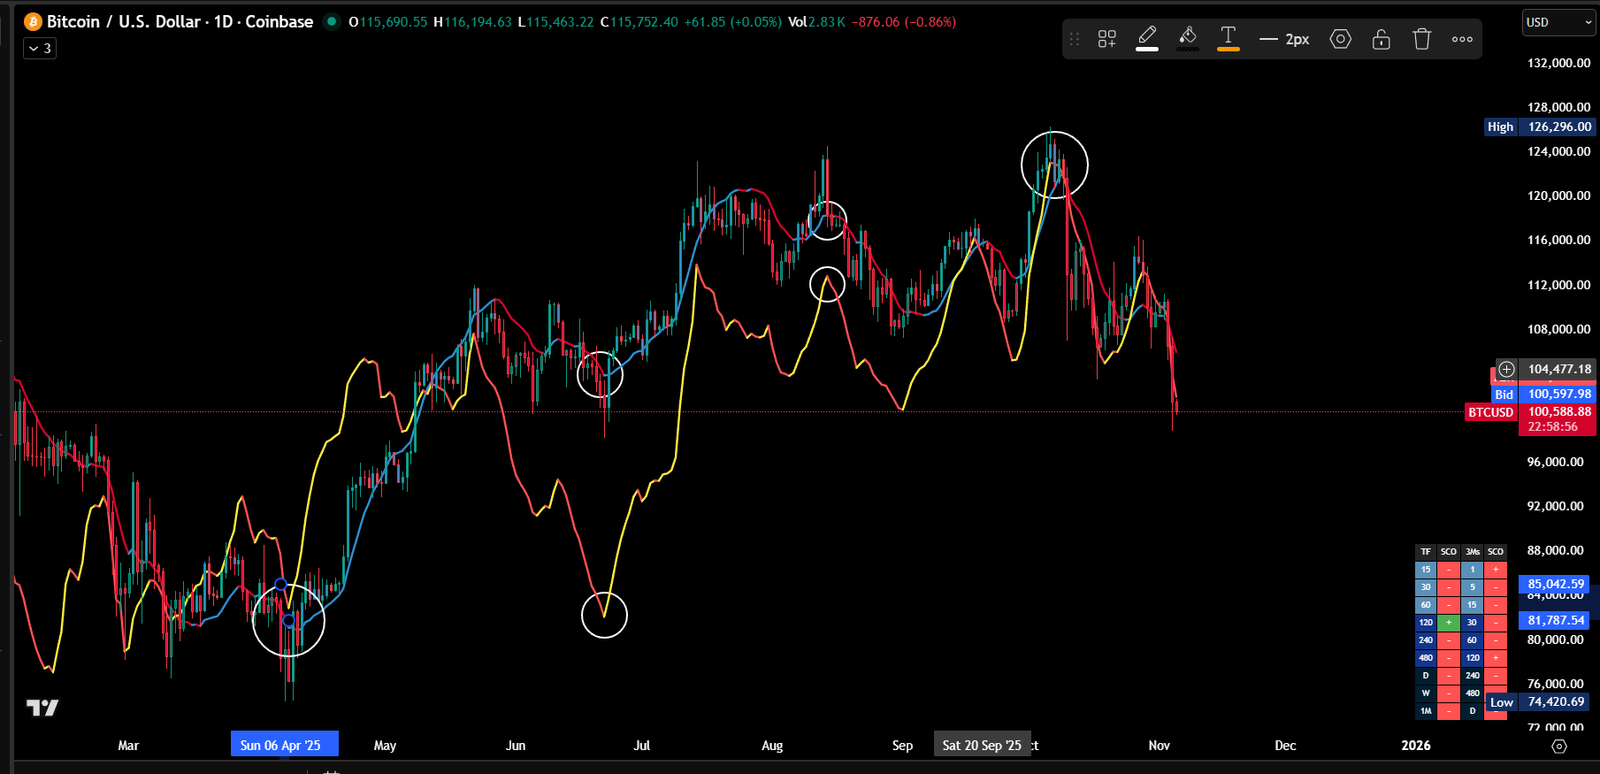
SCO can flag early alignment, but Pill may help determine if that shift is gaining real traction, especially during noisy or indecisive moves. Pill adds context helping to separate signal from static. Historical example for educational use. Not a signal. Not a forecast
Disclaimer!: For educational purposes only. Not investment or trading advice. No representation of accuracy or completeness; no guarantees. Trading involves risk, and past performance is not indicative of future results. You are solely responsible for your own decisions.
Charts, tools, and indicators utilized on this site are primarily provided by TradingView®. TradingView® is a registered trademark of TradingView, Inc., and holds no affiliation with the website owner, developers, or providers described herein.