SIDE — What It Is (And Isn’t)

Forget signal overload. Forget reactive indicators. Forget interpreting noise as intent.
SIDE doesn’t forecast price or predict outcomes. It doesn’t generate buy or sell signals. It doesn’t know your objectives, your strategy, or your position in the market.
What it does is measure internal system agreement.
SIDE observes two structurally distinct models, each interpreting the market through different lenses. When both independently arrive at a directional consensus and meet internal stability thresholds, SIDE outputs a synchronized event.
That output isn’t a recommendation. It’s a readout:
A rare moment when two systems align on directional behavior, without contradiction.
SIDE doesn’t react to every move. It filters for structural coherence and only responds when its internal conditions are met.
It’s not about prediction. It’s about detecting internal consistency across models and surfacing that condition when it occurs.

SIDE is...

• A dual-system agreement detector
• A filter for internal model alignment
• A state-based output engine
• An expression of systemic coherence
• Most useful when read in context with other structural tools

SIDE isn’t...

• A trade signal generator
• A trend prediction tool
• A directional bias confirmation model
• A momentum indicator
• An entry/exit recommendation system

What It Actually Tells You

SIDE tracks whether two independent analytical models, each with its own structure, assumptions, and logic, are currently in directional agreement. When both models align and meet strength conditions, SIDE outputs a visual marker. This alignment is not a forecast or an instruction. It is a system state: a snapshot of internal consensus .

You can think of it like this:
• If the models agree → SIDE expresses that alignment
• If they disagree → SIDE remains silent
• If the agreement lacks strength → no output is shown

Used on its own, SIDE offers insight into systemic consistency.
Used with broader tools like SCO, TPM, PILL, or LPPLCP, it provides additional context for structural evaluation.
SIDE doesn’t tell you what price will do. It reflects what the system currently agrees upon and when that agreement passes its own internal bar for clarity.

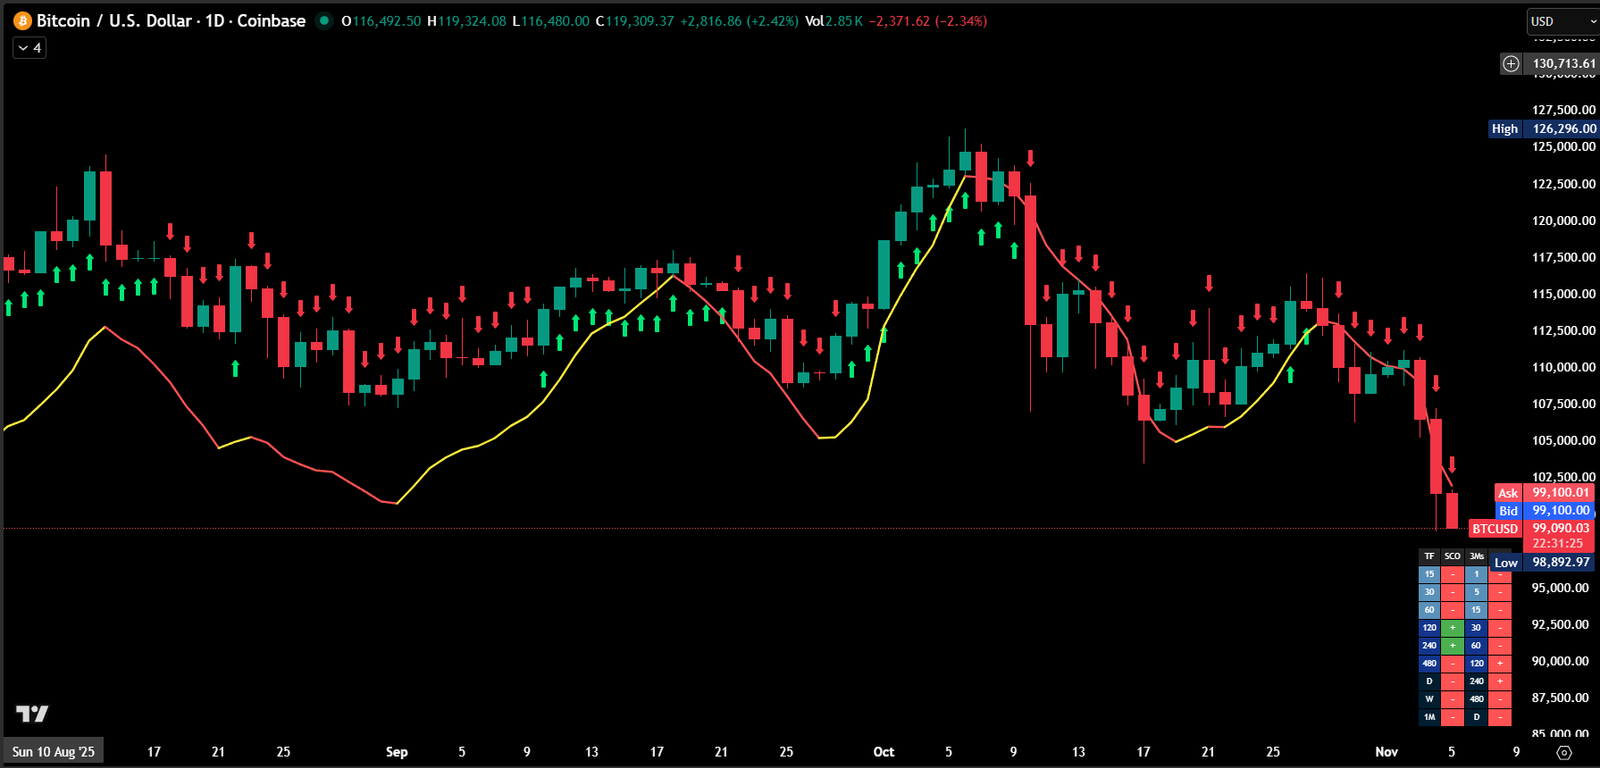
This chart displays structural alignment and internal system agreement:
⦁ Arrows represent moments where two independent estimation models (SIDE) align on directional inference.
⦁ Colored line (SCO) reflects the degree of structural agreement across multiple timeframes.
These tools do not generate trade signals or forecasts. They reflect internal system states and structural conditions for educational and analytical purposes only.

Disclaimer!: For educational purposes only. Not investment or trading advice. No representation of accuracy or completeness; no guarantees. Trading involves risk, and past performance is not indicative of future results. You are solely responsible for your own decisions. Charts, tools, and indicators utilized on this site are primarily provided by TradingView®. TradingView® is a registered trademark of TradingView, Inc., and holds no affiliation with the website owner, developers, or providers described herein.

© 2025 complexitytrading.ai All rights reserved.

LPPLCP (Log Periodic Power Law Critical Pulse ) A multi-tiered visual framework that fuses LPPL structural criticality with dynamic phase overlays, designed to illuminate the evolving rhythm beneath price behavior. It surfaces early signs of exhaustion, convergence, and instability for contextual interpretation—not prediction—allowing experienced users to observe emerging tensions before they resolve into price action. Adaptable across timeframes, though effectiveness may vary with market structure, volatility regime, and analytical intent.

Subscribe Now
Learn More

This will close in 0 seconds

Overwatch acts as a real-time risk management lens. It's your structural risk officer across multiple timeframes. It consolidates five independent engines, tracking flow pressure, volatility asymmetry, structural tension, rhythm instability, and regime drift, into a single adaptive Risk Score. This score is color-coded for interpretive clarity, not prediction, and reflects shifting market fragility from stable to critical. Overwatch doesn’t generate signals or directional advice; it provides a continuous reading on systemic conditions so users can align tactics with context. It is a strategic overlay for assessing vulnerability, not a decision-making system.

This will close in 20 seconds

SIDE (Scale Invariant Dual Estimator) detects directional agreement between two structurally distinct models, each operating with independent logic. It doesn't forecast, signal, or react...it listens. When both systems reach alignment and pass internal strength thresholds, SIDE expresses that consensus as a system state, not a recommendation. It’s not a trade cue. These are moments of internal coherence, surfaced only when the underlying structure agrees with itself.

Subscribe Now
Learn More

This will close in 20 seconds

TPM

This will close in 0 seconds

Coming Soon

Fractal Node Six is a six-regime classification model that organizes market activity into clear, interpretable states — from strong directional alignment to structural noise.
Inspired by our LPPLCP tracks phase instability(among other things), Fractal Node flags when structure itself breaks down. It shows behavior, not just flow. Works on any time frame.

This will close in 20 seconds

Coreline maps dynamic market containment, identifying the boundaries where price tends to stall, reverse, or break free. It does not predict price, issue signals, or chase momentum. Instead, it observes how price behaves at structural thresholds, measuring conviction and response. By highlighting the zones of absorption and containment, Coreline helps contextualize price behavior, not as noise, but as structure. It distinguishes motion from meaning, offering a calm lens on whether price is confined or attempting escape.
.

This will close in 20 seconds

PILL The Pill is a behavioral rhythm lens designed to observe when market structure shifts from passive drift into active directional flow. It does not predict outcomes or issue signals, instead, it interprets internal price behavior through adaptive logic, highlighting moments when structure appears to gain coherence. Blue suggests constructive rhythm; red implies disorganization or loss of intent. These are not instructions, but visual cues, meant to be interpreted, not followed. Best used in conjunction with structural tools like SCO or TPM, The Pill helps contextualize when potential movement begins to carry weight.

Subscribe Now
Learn More

This will close in 20 seconds

Coming Soon

The Super Oscillator comprises four normalized inputs that are distilled into a single visual system state. No plots. Just convergence, saturation, and signal decay, all rendered in color. A great compliment to the LPPLCP. Where LPPLCP marks exhaustion, this shows the broader coherence breakdown.

This will close in 20 seconds

SCO (Scale Convergence Overlay) A structural alignment overlay designed to reveal when multiple time-domain layers begin to shift in synchrony. SCO blends normalized signals from orthogonal models into a composite rhythm, helping experienced users detect evolving consensus across Micro, Meso, and Macro tiers. It offers a real-time perspective on regime fluidity...not trade entries...supporting contextual awareness in environments where structure, volatility, or direction may be rebalancing. Interpretation requires domain expertise and should be used in conjunction with complementary tools and discretion.

Subscribe Now
Learn More

This will close in 20 seconds